
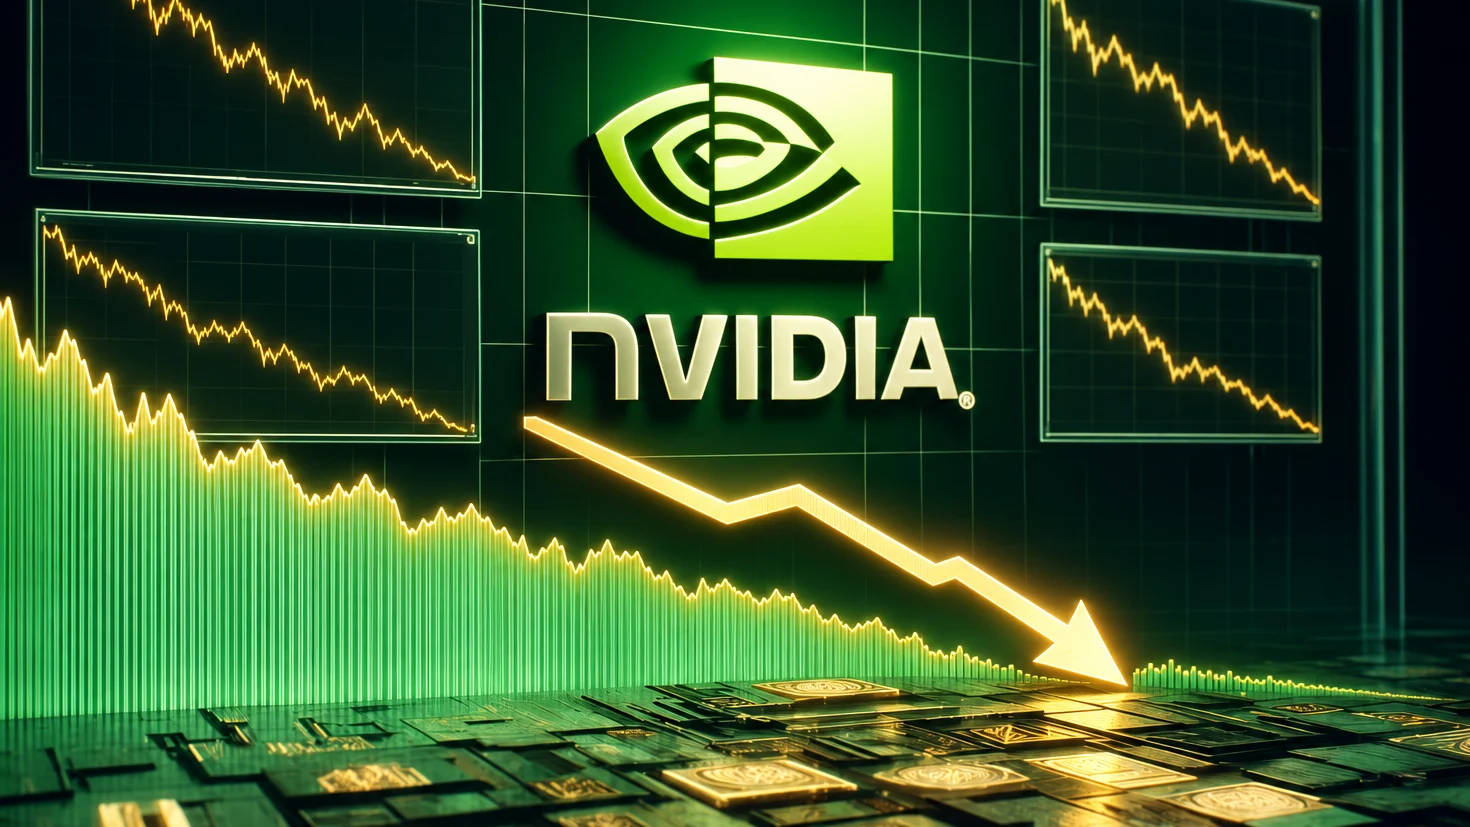
Nvidia and the AI collapse: bursting bubble or a buying opportunity?
The fall in technology stocks reopens the debate between industrial value and financial expectations. To tell a discount from a trap, investors must look at future earnings, the quality of demand and the sustainability of investment
The market can continue to believe in artificial intelligence and, at the same time, decide to pay far less for it. That is the apparent contradiction at the heart of Nvidia’s collapse and the fall in shares linked to the build-out of the digital infrastructure. There is no need to assume that AI is an empty promise in order to understand such a violent decline: it is enough for valuations to have priced in growth that was too fast, too profitable or too enduring. When those expectations are called into question, even companies with strong results can suffer heavy losses.
Friday’s session on 20 November 2026 made the issue plain. Nvidia closed at $125.53, down 14.01% on the day. Versus the closing peak of $239.24 on 6 October, the decline is about 47.5%: almost half the value in less than two months. On the same day, the Nasdaq Composite lost more than 5%, while the S&P 500 entered correction territory, more than 10% below its October high. It is important to use closing prices and consistent time periods, avoiding a mix of intraday highs, trading-session quotes and post-close values.
The Wall Street Journal described the week as a destruction of around $4 trillion in value in the market tied to the technology boom. The loss of market capitalisation does not, however, mean cash has been physically withdrawn from corporate coffers: it is a reduction in the value the market attributes to companies’ shares. The consequences can still become real, through greater difficulty in raising capital, a lower willingness to spend and a deterioration in investor confidence.
A correction describes the decline, a bubble seeks to explain it
In financial language, a correction conventionally indicates a retreat of at least 10% from the highs; beyond 20%, one generally speaks of a bear market. These thresholds describe the scale of the move, without determining whether the previous price was justified. A financial bubble, by contrast, concerns the relationship between price, economic prospects and the expectation of being able to resell at even higher levels. For that reason the two expressions are not perfectly opposite alternatives: a correction can interrupt a phase of excess or turn into the deflation of a bubble.
The length of the recovery, on its own, does not settle the matter. An asset can go through a speculative episode, collapse and later reach new highs thanks to different conditions. Or it can fall without ever having been at the centre of a bubble, because the cost of capital, competition or expected profits change. To say that a future return to the highs would prove the absence of a financial bubble would therefore be too categorical. The key point is to understand which assumptions supported the old valuations and which ones may support the new ones.
Nvidia has a real business: the question is how much it is worth
The distinction is particularly important for Nvidia, which is not merely an industrial promise. In results published on 17 November, covering the third quarter of fiscal 2027, the company reported revenue of $115.8 billion, up 103% year on year. The Data Centre division reached $107.6 billion, with growth of 110%, while the reported gross margin was 74.8%. These are company figures that show the economic scale already achieved by demand for computing power.
Precisely such strong results make the valuation more delicate. The market does not buy only the revenue already booked: it assigns a value to future revenue, to margins and to the ability to preserve them. A company can keep growing and still see its share price fall if investors were expecting even more. It can also lose value because uncertainty rises over the quality of earnings, the continuity of orders or the ability to maintain a dominant position. Industrial growth and the return on an equity investment remain two different outcomes.
On top of the revision to expectations come company-specific factors. Reuters linked the latest decline to reports of an SEC investigation into the company’s accounting, while the group is also going through a leadership transition. An investigation is not the same as a finding of wrongdoing, but it can increase the risk premium investors demand. That is why Nvidia’s collapse should not be read as a pure measure of confidence in the whole of artificial intelligence: it also contains company-specific risks.
The decisive question: who will pay the AI bill?
The economic crux of the chain is the move from building the infrastructure to being paid for using it. Buying processors, building data centres and securing energy immediately creates demand for some suppliers. But to justify the entire cycle of investment, those using that infrastructure must generate enough revenue to cover operating costs, depreciation and the capital employed. A technology can improve productivity without distributing adequate profits to all the companies that help develop it.
That is where the risk of a mismatch arises: productive capacity is being built today on the basis of paying demand that may arrive more slowly. Technological progress also has a double effect. More efficient systems can reduce the cost of AI, broaden its use and encourage new services; at the same time, they can alter the need for hardware or accelerate the obsolescence of existing infrastructure. There is no automatic outcome: one must observe whether higher volumes offset lower prices and which companies manage to retain the value created.
The financial relationships between suppliers and customers also deserve attention. When a company invests in the capital of an entity that buys its products, the relationship can support legitimate industrial development. The investor must, however, assess how much demand is being fuelled by economically independent customers and how much depends on continuing access to new funding. This is not about assuming wrongdoing, but about distinguishing the strength of end demand from the availability of capital that allows it to be brought forward.
A third of the S&P 500 does not mean a third is just AI
The weight of the Magnificent Seven makes this story important even for those who do not own Nvidia directly. At the beginning of November, the group accounted for about 33.7% of the S&P 500. It is nevertheless necessary to note that this percentage refers to seven large companies with different activities, not to a sector made up exclusively of artificial intelligence companies. Apple, Microsoft, Alphabet, Amazon, Meta, Nvidia and Tesla have varying exposures to software, advertising, retail, hardware and other markets. The weight also changes with share prices.
Concentration remains high in any case. According to an analysis by Charles Schwab, as of 31 October the ten largest companies accounted for about 39% of the index. For a saver, owning hundreds of stocks through a fund therefore does not eliminate dependence on a few big companies. Exposure can rise further if technology funds, thematic products and individual shares containing the same names are added to the same investment. Diversification must be measured by the actual holdings and common risk factors, not by the number of instruments bought.
The Bitcoin precedent: relevant, but it must be reconstructed
The comparison with Bitcoin is useful if it concerns investor behaviour in the face of an asset that has posted sharp gains. It is less useful if it becomes an automatic forecast of what comes next. The sequence closest to the one being recalled does not begin at $50,000: Bitcoin reached around $69,000 in November 2021, before falling to the area of $15,500 in November 2022, a drop of nearly 77%. Exact figures vary slightly depending on the platform and the method of observation.
The previous high was surpassed in March 2024, after more than two years; the first move above $100,000 came on 5 December 2024. The recovery was notable, but not immediate for anyone who bought at the peak of the cycle. Nor was it simply a mechanical continuation of the past: in the meantime, investor access to the market and the financial backdrop had changed, including through the arrival of US spot ETFs.
| Bitcoin cycle milestone | Period | Indicative price |
|---|---|---|
| 2021 cycle peak | November 2021 | $69,000 |
| Subsequent low | November 2022 | $15,500 |
| Breaking the previous peak | March 2024 | Above $69,000 |
| First time above $100,000 | 5 December 2024 | Above $100,000 |
The lesson is not that every major fall prepares a new record. It is that the violence of the decline is not enough to prove the disappearance of economic value or demand for an asset. But the opposite is also true: the recovery of one successful case does not guarantee that of others. Looking only at those that returned to their highs introduces a favourable selection of precedents, leaving out investments that never recovered or companies that permanently lost their position.
Nvidia and Bitcoin have different valuation criteria
Bitcoin is a native digital asset on a blockchain-based network; an Nvidia share, by contrast, represents an ownership stake in a company. In the second case it is possible to analyse earnings, cash flows, the balance sheet, competition and the return on capital. Bitcoin does not confer a claim on a company’s profits. This difference makes it impossible to transfer recovery times and price targets directly from one market to the other.
There are, however, common financial mechanisms: collective enthusiasm, fear of missing out, use of leverage and forced selling. When many operators share the same conviction, the move can intensify both on the way up and on the way down. The resemblance of the charts can therefore help with thinking about volatility and market psychology. It does not replace analysis of what underpins the value of the individual investment.
A halved price can still be expensive
The word discount presupposes a point of comparison. A share that loses half its value is cheaper than at its peak, but not necessarily cheaper relative to future earnings. If the price falls by 50% and expected earnings remain unchanged, the price/earnings ratio is halved. If expected earnings also halve, that ratio stays the same. If prospects deteriorate even further, the share can end up more expensive than before despite the decline.
A hypothetical example makes the point clear. A share at €200 with expected earnings of €5 is valued at 40 times earnings. At €100, with the same forecast, the multiple falls to 20. But if sustainable earnings are revised down to €2, the multiple rises to 50. Referring to the old high can therefore become a misleading anchor: the market has no obligation to take a share back to where it previously stood.
Buying gradually: a strategy that must rest on results
Accumulating after a fall can make sense when the price already incorporates a sufficiently cautious scenario, the company retains a competitive position and the capital invested can tolerate further swings. Spreading purchases over time reduces dependence on a single entry day. It does not, however, eliminate the risk of repeatedly buying a company whose prospects continue to deteriorate.
For Nvidia and the AI supply chain, the decisive checks concern the conversion of earnings into cash, the financial strength of customers, the continuity of orders and the ability to defend margins. Added to these are the outcome of corporate and regulatory issues and the comparison between the new valuations and less favourable growth scenarios. A rebound of a few sessions can also accompany a downward trend: on its own, it does not confirm that the low has been reached.
Three possible outcomes, with no pre-written ending
The first scenario is a valuation correction: the industrial business remains solid, while the market lowers the price it is willing to pay for growth. In this case opportunities may emerge, without the recovery needing to be rapid or uniform. The second is a deflation of excesses: part of the investment is scaled back, the more fragile players run into difficulties and the leaders survive with prospects different from those initially imagined. Innovation continues, but not all shareholders recover their losses.
The third is a deeper crisis, in which insufficient end demand, financing difficulties and a reduction in investment reinforce one another. The data available do not allow us to choose one of these paths with certainty. They do, however, allow us to reject two automatic assumptions: that a technology destined to spread justifies any price, and that a share that has almost halved is necessarily a bargain. The useful question, in the face of Nvidia’s collapse, is not how far it is from returning to its peak: it is what the results the company can produce tomorrow are worth today.
Tags
Related articles

Newsletter
The Patrimoni & Finanza newsletter
A considered selection of analysis on economy, Real Estate and wealth
Patrimoni e Finanza — La selezione della settimana: weekly newsletter, sent in Italian
After you submit, if the address can be subscribed you will receive an email with a link to click: the subscription starts only after the click